How can I find Correlations in data?

Here is an example of our “Correlation” recipe.
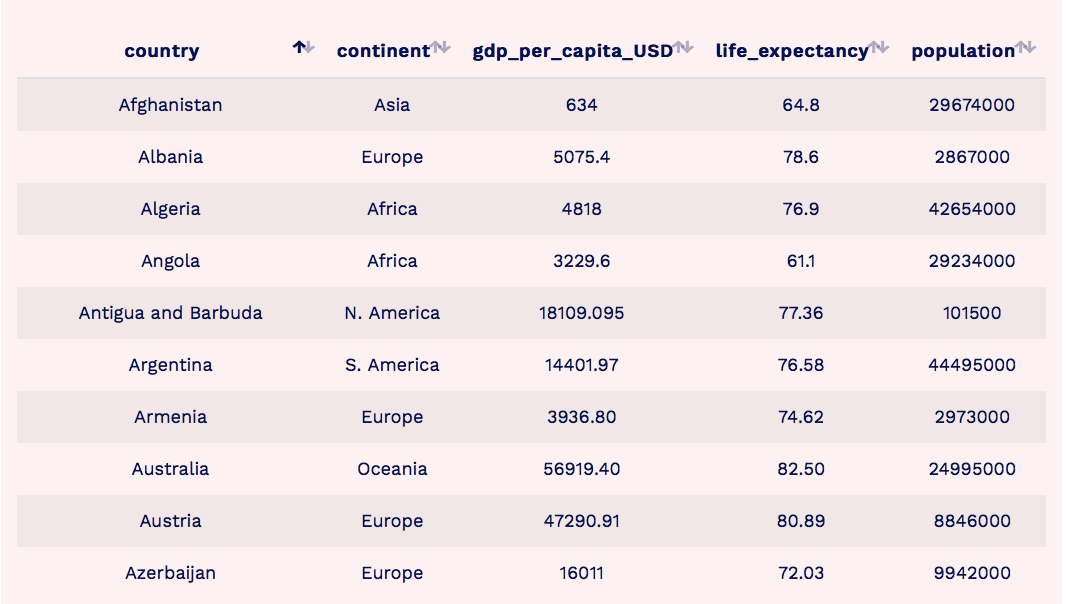
Let’s say we want to find out how different economic indicators are correlated with the population of a country and its life expectancy.
Using A+Ω, we analyzed data from 195 countries such as the GDP per capita, population figures and life expectancy.
For this example we used data from: IMF, World Bank, tradingeconomics.com and Britannica.com.
We uploaded our excel or csv on A+Ω,
And the algorithm found the following correlations:

A+Ω will show you the first 5–10 correlations. Depending how many data are in the file you uploaded, there might be just few columns and rows, so you get fewer correlation results but you may also upload an excel / csv with hundreds or thousands of rows and columns. In that case, there may be many more correlations between the data. A+Ω will show you the most strong ones.
How to interpret the correlations A+Ω found:

The first correlation is the country with the continent. Well, it might be obvious for you as human, but not for the algorithm. So, you may get correlations which are self-evident.

The second correlation is the GDP per capita with life expectancy. In the parenthesis you will see an arrow facing up. What does this mean? When the GDP per capita of a country increases, so does life expectancy. GDP per capita is a measurement of a country’s standard of living. It tells you how prosperous a country feels to each of its citizens. So the above correlation may sound logical: Countries where citizens are prosperous, live longer.

While life expectancy decreases (arrow facing down) as the population grows.

The GDP per capita also decreases as the population of a country grows.
Note that A+Ω can make correlations only between columns and that can not make any correlation between text and arithmetic data. In case you get correlation results between such columns, check your data again: there might be numbers or text in a column where it shouldn’t be.